KillZones Hunt + Sessions [TradingFinder] Alert & Volume Ranges🟣 Introduction
🔵 Session
Financial markets are divided into various time segments, each with its own characteristics and activity levels. These segments are called sessions, and they are active at different times of the day.
The most important active sessions in financial markets are :
1. Asian Session
2. European Session
3. New York Session
The timing of these major sessions based on the UTC time zone is as follows :
1. Asian Session: 23:00 to 06:00
2. European Session: 07:00 to 16:30
3. New York Session: 13:00 to 22:00
Note
To avoid overlap between sessions and interference in kill zones, we have adjusted the session timings as follows :
• Asian Session: 23:00 to 06:00
• European Session: 07:00 to 14:25
• New York Session: 14:30 to 22:55
🔵 Kill Zones
Kill zones are parts of a session where trader activity is higher than usual. During these periods, trading volume increases and price fluctuations are more intense.
The timing of the major kill zones based on the UTC time zone is as follows :
• Asian Kill Zone: 23:00 to 03:55
• European Kill Zone: 07:00 to 09:55
• New York Morning Kill Zone: 14:30 to 16:55
• New York Evening Kill Zone: 19:30 to 20:55
This indicator focuses on tracking the kill zone and its range. For example, once a kill zone ends, the high and low formed during it remain unchanged.
If the price reaches the high or low of the kill zone while the session is still active, the corresponding line is not drawn any further. Based on this information, various strategies can be developed, and the most important ones are discussed below.
🟣 How to Use
There are three main ways to trade based on the kill zone :
• Kill Zone Hunt
• Breakout and Pullback to Kill Zone
• Trading in the Trend of the Kill Zone
🔵 Kill Zone Hunt
According to this strategy, once the kill zone ends and its high and low lines no longer change, if the price reaches one of these lines within the same session and is strongly rejected, a trade can be entered.
🔵 Breakout and Pullback to Kill Zone
According to this strategy, once the kill zone ends and its high and low lines no longer change, if the price breaks one of these lines strongly within the same session, a trade can be entered on the pullback to that level.
Trading in the Trend of the Kill Zone
We know that kill zones are areas where high-volume trading occurs and powerful trends form. Therefore, trades can be made in the direction of the trend. For example, when an upward trend dominates this area, you can enter a buy trade when the price reaches a demand order block.
🟣 Features
🔵 Alerts
You can set alerts to be notified when the price hits the high or low lines of the kill zone.
🔵 More Information
By enabling this feature, you can view information such as the time and trading volume within the kill zone. This allows you to compare the trading volume with the same period on the previous day or other kill zones.
🟣 Settings
Through the settings, you have access to the following options :
• Show or hide additional information
• Enable or disable alerts
• Show or hide sessions
• Show or hide kill zones
• Set preferred colors for displaying sessions
• Customize the time range of sessions
• Customize the time range of kill zones
"order block" için komut dosyalarını ara

Sessions Lite [TradingFinder] New York, London, Asia, NYSE Forex🔵 Introduction
A trading session is one of the basic concepts in the financial market that refers to specific time periods. In fact, a session means hours during the day and night, during which traders in a certain part of the world conduct their transactions.
Although the "Forex" and "CFDs" market is open 24 hours a day and it is possible to trade in it, but in some hours the activity in this market decreases so much that many traders prefer not to trade and only watch the market. On the other hand, there are specific times when the market is very busy and dynamic, and many traders tend to trade during these hours of the day and night.
Trading sessions are usually divided into three main categories, which are "Asian", "European" and "North American" sessions. These trading sessions are also called the "Tokyo", "London" and "New York" sessions, respectively. But they also categorized these sessions in more detailed ways such as "Sydney session", "Shanghai session" or "NYSE session".
🔵 Tokyo trading session (Asian session)
After the weekend that happens on Saturday and Sunday, the Forex market starts with the Asian session. In this continent, most of the transactions are done in the Tokyo session, and for this reason, it is usually called the Asian session or the Tokyo session. However, other countries such as Australia, China and Singapore also do a lot of trading in this session.
The Tokyo session has a lower volume of transactions compared to the London and New York sessions, and therefore the liquidity is lower. In this session, most of the Forex currency pairs move in a price range. For this reason, different people use the ups and downs with the trading strategy in the range and get profit.
The low liquidity of the Tokyo session means that trading spreads are also higher during these hours. Besides, most of the transactions of this session are done in the early hours and at the same time as the planned news release.
In the Tokyo or Asia session, the best currency pairs to trade are the "Japanese yen", the "Australian dollar", and the "New Zealand dollar".
"Nikkei" index is also a good option for trading. If you trade in the Tokyo session, you should also be aware of the release of economic news and data from Australian, New Zealand and Japanese financial institutions.
🔵 London trading session (European session)
After the Asian session, it is time for the European session. In this period of time, transactions are very large and many European markets are involved. However, the European session is usually known as the London session.
Because of its specific time zone, London is not only known as the Forex trading center in Europe, but it is also known as the Forex trading center in the world. The London session overlaps with two other major trading sessions in the world, Asia and America. This means that most of the Forex transactions are done in this session. According to the latest statistics, 32% of Forex transactions are related to the London session, which shows that about a third of the activity performed in Forex takes place during this period.
This will increase the volume of Forex transactions and increase liquidity. An event that causes the spread of transactions to decrease. Of course, high liquidity also leads to greater volatility, which is desirable for many traders.
In the European session, the pound and euro currencies and the "DAX", "FTSE100", and "CAC40" indices are known as the best tradable assets. Also, traders of this session should pay attention to the news and data published by the "European Central Bank" and the "Bank of England". The news of countries like Germany, France and Italy are also very important.
🔵 American trading session (New York session)
When the New York session begins, several hours have passed since the end of the Tokyo session, but the European session is in the middle. In this session, they usually affect the financial activities carried out in America, but they also affect other countries such as Canada, Mexico and several South American countries.
The "US dollar" and stock indices such as "S&P", "Dow Jones" and "Nasdaq" are the most important assets that are traded in this session.
The early hours of the American session have a lot of liquidity and volatility due to the overlap with the European session, but with the end of the European session, the activity in the American session also decreases.
You can trade all major Forex currency pairs in the New York trading session. In this session, the "Federal Reserve", as the most important central bank in the world, is the institution that you should pay attention to its news and data.
The trading session indicator is an analytical tool in the financial markets that is used to display and analyze specific trading periods during a day. These indicators are generally useful for determining support and resistance levels during any trading session and for detecting different trading patterns.
For example, usually these indicators display the open and close price levels, the highest and lowest prices during a trading session. Also, you may notice various price patterns such as price channels, price phase phases and market trend changes during different trading sessions using these indicators.
🔵 cause of construction
In particular, the session light indicator version is designed and built for those traders who use many different tools on their chart at the same time. These traders can include "Volume Traders", "ICT traders", "Day Traders" and... These individuals can use "Session Lite" without disturbing the display of their other trading tools such as "Order Blocks", "Liquidity", "Zigzag", "FVG" etc.
But in general, there are several reasons for making tools like trading session indicators in financial markets, some of which include the following :
1. Analysis of specific time frames : Some traders and investors like to consider specific time frames for price analysis and review. For example, analyzing price changes during each trading session can help analyze trading patterns and identify trading opportunities.
2. Recognize different price patterns : Different price patterns may be observed during trading sessions. Trading session indicators can help to make better trading decisions by analyzing these patterns and their strengths and weaknesses.
3. Identifying Support and Resistance Levels : These tools may help to identify support and resistance levels during any trading session which can be helpful in deciding whether to enter or exit the market.
🔵 How to use
The Session Lite indicator displays 8 sessions by default. Asia session, Sydney session, Tokyo session, Shanghai session, Europe session, London session, New York session and New York Stock Exchange (NYSE) session are the sessions that are displayed.
You can activate or deactivate the display of each session by using the tick button next to the name of each session.
Two gray vertical dashes are also displayed by default, which indicate the beginning of the European session and the New York session. This feature is available for all sessions, but it is enabled by default only for these two sessions, and you can activate it for the rest of the session. You can enable or disable the display of this line by using the Start Session tick key.
Likewise, the information table is displayed by default, which includes the open or closed information of each session and the start and end times of each session. These timings are based on the UTC time zone.
Accordingly, the schedule of trading sessions is as follows :
Asia session from 23:00 to 06:00
Sydney session from 23:00 to 05:00
Tokyo session from 00:00 to 00:06
Shanghai session from 01:30 to 06:57
European session from 07:00 to 16:30
London session from 08:00 to 16:30
New York session from 13:00 to 22:00
New York Stock Exchange (NYSE) session from 14:30 to T 22:00
Important note : the beginning of the European session coincides with the opening of the Frankfurt market.
🔵 Settings
• In the settings section, there are customization capabilities according to the type of use of each user. The settings related to showing or not showing the box of each session, the start indicator of each session, setting the start and end time of the session and choosing the desired color to display each session are among the things that can be set from this section.
• At the end of the settings, you will see the "Info Table" option; By disabling this option, the "sessions" clock table displayed on the upper right side will be disabled.

Market Structure CHoCH/BOS (Fractal) [LuxAlgo]The Market Structure CHoCH/BOS (Fractal) indicator is an experimental take on classical market structure, whereas fractal patterns are used for their construction instead of swing points.
Compared to utilizing swing points for highlighting market structure like our Smart Money Concepts indicator , fractal-based market structure can appear as more adaptive, however, it can also be more restrictive when it comes to returning swing points which can cause the indicator to miss reversals in some cases.
If enabled from within the settings, users can see support and resistance levels returned from the detected market structure with breakouts highlighted on the chart. Alongside this feature, an additional dashboard showing the structure to fractal structure percentage is also provided.
🔶 SETTINGS
Length: Length of the fractal patterns to detect.
🔹 Style
Bullish Structures: Show bullish structures.
Bearish Structures: Show bullish structures.
Support: Show support levels.
Resistance: Show resistance levels.
🔹 Dashboard
Show Dashboard: Show structure to fractal percentage dashboard on the chart.
Location: Location of the dashboard on the chart.
Size: Dashboard size.
🔶 USAGE
Market structure is commonly used to determine trend direction by using price positions relative to prior swing points. Using fractal patterns to determine market structure can allow users to obtain shorter, more frequent structure labels.
Market structure is commonly classified as follows:
Change of Character (CHoCH), also referred to as Market Structure Shift (MSS)
Break of Structure (BOS), also referred to as Market Structure Break (MSB)
Change of Characters indicate a shift in the market trend, confirming trend reversals. Break of Structures on the other hand occur once a trend is already determined, confirming new higher highs/lower lows.
Using higher length values allow users to detect longer-term fractals, thus highlighting longer-term market structures. The image above detects fractal patterns made of 7 candles, even if the increment is only of 2 bars this significantly reduces the amount of detected market structure labels.
The result obtained by utilizing fractals and higher settings can be a more dynamic view of market structure, however, as seen in the image above this can introduce very significant delay compared to utilizing pure swing points.
🔹 Support/Resistance
The indicator also returns support/resistance levels constructed from the market structure, these levels are obtained similarly to order blocks, finding the minimum on the interval of a bullish market structure and the maximum of a bearish market structure.
Price reaching a support/resistance level can be expected to bounce from it. Once a level is broken, the support/resistance level will no longer extend, and a circle will be displayed highlighting the break.
While utilizing this script for fractal-based market structure, these levels can be useful to ensure all swing points are still considered by the user with the possibility of the indicator missing reversals due to its calculation not being based on swing points themselves.
🔹 Dashboard
The dashboard reports the structure to fractal percentage, that is the amount of bullish/bearish market structures relative to the total amount of detected bullish/bearish fractal patterns.
This allows us to see how often a detected fractal pattern is used to display a market structure.
🔶 DETAILS
🔹 Fractals
In the context of technical analysis, Fractals refer to specific patterns that exhibit self-similarity at different scales or timeframes.
The most commonly known fractal pattern consists of a consecutive sequence of candles (more commonly 5), with the central candle being the lowest (in case of a bullish fractal) or highest (in case of a bearish fractal).
A bullish fractal has candles on the right side of the central candle with increasing lows, while candles on the left side have decreasing lows.
A bearish fractal has candles on the right side of the central candle with decreasing highs, while candles on the left side have increasing highs.
🔶 RELATED SCRIPTS
🔹 Smart Money Concepts
🔹 Market Structure Trailing Stop
🔹 ICT Concepts

Mora's Compression IndicatorIntroducing Mora's Price Compression indicator.
One of the biggest challenges in trading strategies is to differentiate between zones in which price is consolidated (so called squeezed) and zones of price expansion. Zones of consolidation can indicate traders' indecision or the creation of order blocks, but regardless of their mechanism, most indicators behave differently in those areas as oppose to times when price is trending.
A traditional indicator of consolidation zones is the so call Squeeze, which combines Bollinger Bands and Keltner’s Channels.. although broadly used, its interpretation is not quite straightforward.
Here a new indicator is introduced to identify areas of consolidation or expansion based on current and historical volatility.
Ultimately we know the price is consolidated (current volatility) when it starts raging within a narrower band that we are use to see (Historical volatility), so the ratio of the current to historical volatility becomes a straightforward identification of consolidation zones and that is what this indicator provides.
The indicator is scaled such that values near zero mean price is compressed and values near 100 price is over-extended. The indicators is designed to allow different time-frames, while avoiding repainting.

Visualizing Displacement [TFO]An easy and basic way to visualize displacement (energetic moves) in single bars/candles. This is determined by comparing the bar range (either from high to low, or from open to close) to its standard deviation over some specified length. The strength parameter applies some multiple to the standard deviation, which can help to filter out only the strongest indications of potential displacement.
Displacement is a key concept in Inner Circle Trader (ICT) concepts, especially when anticipating potential changes in trend. Although it's fairly easy to see "displacement candles" with large ranges, the bar coloring in this script can help remind us of who is in control (buyers or sellers) based on what side is creating those energetic moves most recently. Once we see signs of displacement, we can then apply concepts like premium/discount, order blocks, optimal trade entries, etc. to look for reasonable trade opportunities in the direction of the current trend.
A lack of displacement can be just as telling - if an effort to displace through a key swing high/low has failed, it's possible that a reversal may be underway.
MTF High and Low FractionsMTF High and Low Fractions
Description
An experimental script that prints 1/3, 1/4 and 1/8 levels of the previous timeframe's high and low to the current timeframe. The idea is quite simple. It mirrors the the previous high and low with user selected levels. The default setting is the previous daily high and low but can be customized on user discretion.
New levels are printed after the close of the previous timeframe and open of the new timeframe (user's timeframe setting).
How To Use
Levels should not be used blindly. Levels can be used as confluence when aligned with high probability supply and demand zones, support, resistance, order blocks, and so on.
Swing High/Low Indicator w/ MACD and HTF EMA'sSwing High/Low Indicator w/ MACD and EMA Confirmations by KaizenTraderB
I designed this indicator to be used with a market structure break strategy.
It labels swing highs and lows that are confirmed by the MACD.
It also displays a higher timeframe Fast and Slow EMA to determine directional bias.
Also provides alerts that signal Swing Low breaks in downtrends and Swing High Breaks in uptrends.
It draws a horizontal line on the last Swing High and Low.
Display this indicator on your entry timeframe and choose your Higher Timeframe in settings.
You can also change lookback period for Swing Highs and Lows and EMA's.
When I use this I am looking for the Swing High/Low break in direction of HTF Trend
Then look for pullback between price level of break and areas of liquidity (wicks, order blocks, price congestion) for entry in direction of EMA trend.

TotalCap RSI and Pressure CandleCandles and areas where force is applied.
Special to see divergences and possible Order Blocks
The RSI is applied on the TOTALCAP to be able to visualize when the entire market is in turning conditions

MTF previous high and low quarter levelsDescription
An experimental script that prints quarter levels of the previous timeframe's high and low to the current timeframe. The idea is quite simple and is basically the Fibonacci pivoted on the previous high and low with quarter level settings (0,0.25,0.5,0.75,1 etc). The default setting is the previous daily high and low but can be customized on user discretion.
New quarter levels are printed after the close of the previous timeframe and open of the new timeframe (user's timeframe setting)
How To Use
Levels should not be used blindly. Levels can be used as confluence when aligned with high probability supply and demand zones, support, resistance, order blocks, and so on.
Credit to @HeWhoMustNotBeNamed for the Previous High/Low MTF indicator code and @mrbirman for the idea to put this together.

SMT - Smart Money Thursday Boxes
The Smart Money Trading Thursday - is a very specific trading system. You only trade it on a Thursday.
The script/indicator will color Thursdays as two boxes. If you just want one color, use same color for
both boxes. The boxes is there to indicate London/New York sessions.
SETTINGS
In the setting you find a numeric value as 1700-0400:5
The "5" indicate Thursday. You can change that if you prefer to color another specific day.
For example "4" would indicate Wednesday. And you can change the hours to fit your
sessions and trading style.
You can also use the 2 boxes on different days. If you for example would like to color up
London for Wednesday and Thursday. Then set hours to fit London session and adjust the
:5 to 4 on the 1st box and 5 on the 2nd.
HOW TO USE IT?
The Smart Money works in a way retail trading does not. Smart Money has an objective
to locate retail patterns, where there will be a lot of stop loss volume to be grabbed.
So when a retail trader see a setup like a "Double Top / Bottom". The Institutional
will see $$$ of dumb money, ready to be taken. The best moves happen on a Thursday
but if you are a skilled trader, you can see the move also occur on Wednesday or Friday.
The first thing that will happen, is that the Smart Money Breaks out of session. Meaning
they will leave the current weeks high/low range. To start collect negative contracts
of the retail volume.
When you see that happen. And you see a breakout that consist of 4 in a row 1 hour
chart candles. Then you have your first rule meet.
#1 Thursday breakout of current weeks high/low. And the move is a clean 4 hour move
as 4x H1 candles. The move can start within range. But must end clearly outside.
Visual Example:
#2 Next, we await an engulf at peak or near peak. That is where Institutional
may have problem to match any more contracts, and since they used their own
money to make this move. They must now mitigate orders, and return back to
the original retail pattern as most retail traders are now stopped out.
(Normally this is a long/clear candle out of range. they rarely go lower
then retail traders entry in the 1st push. This to not save any souls :)
#3 Price returns back to where the breakout from the retail happens.
You can now take your profit as a Smart Money Trader. Trading with less risk,
you can take profit of the return of that latest 4x H1 candle move. (Order
Block)
CONCLUSION
The best trade is when you can combine a retail pattern, followed by a
breakout which holds 4x 1 hour candles in the outbreak direction.
2nd best is when you have the 4x H1 breakout and really no clear retail
pattern. Still is the same game. Just not as clear as the one above.
Study the steps in this image and you see what to look after:
Good Luck with your trading!
Regards,
The Hunter Trading Group

Bästa Bob Multi-RSI 😎👊✅ RSI 7 → Fast impulse indicator
• Shows micro-movements
• Reacts instantly to liquidity sweeps
• Perfect for entry timing
✅ RSI 14 → Macro momentum indicator
• Captures the real trend
• Filters out noise
• Confirms larger market movements
When both are in sync → you get true market direction plus perfect timing.
👉 How to Use RSI 7 + RSI 14
1️⃣ Entry Signals (the best method)
BUY when:
• RSI 7 turns up from oversold
• RSI 14 is also sloping upward or gets crossed by RSI 7 from below
→ Extremely accurate right after a liquidity sweep.
SELL when:
• RSI 7 turns down from overbought
• RSI 14 is sloping downward or gets crossed by RSI 7 from above
→ Works insanely well for fakeouts and FVG entries.
2️⃣ Trend Filter
• When RSI 14 stays above 50 → market is bullish
• When RSI 14 stays below 50 → bearish
RSI 7 is then used only for timing entries.
3️⃣ A++ Setups (your favorite ones 😉🔥)
The best signals appear when:
✔ RSI 7 crosses RSI 14 at the same time as:
• a liquidity sweep happens
• price taps into an FVG or Order Block
• volume reacts
• your trend filter (EMA, HTF) supports the move
This combo is criminally effective when scalping BTC, NAS100, and XAUUSD.

Market Maker Position Bars (Position Size)**Market Maker Position Bars (Position Size) – Indicator Description for TradingView**
This indicator is a clean, professional visualization tool designed for traders who track suspected **market maker / institutional positioning** (especially popular in ICT/SMC communities) on indices like the SPX, NDX, ES, etc.
It draws up to **20 horizontal position bars** directly on the chart, anchored to the very last bar, representing hypothetical long and short positions at specific price levels with corresponding position sizes.
### Key Features & Visual Logic
- **Green bars (Boxes 1–10)** → Extend to the **right** of the last bar
Represent **long positions** (bullish interest)
Default translucent green fill
- **Red bars (Boxes 11–20)** → Extend to the **left** of the last bar
Represent **short positions** (bearish interest)
Default translucent red fill
- **Bar width = Position size**
The length of each box is automatically scaled based on the absolute value you enter in “Position Size”.
Larger position → wider (longer) bar
- Each box displays **Price / Position Size** text inside (e.g., `5720.50 / 1250`)
### Fully Customizable Settings
**Global Geometry**
- Total Box Height (default 10.0) – controls vertical thickness of all boxes
**Position Size Scaling**
- Base Box Width (bars)
- Width per Position Unit – fine-tune how aggressively width grows with size
- Minimum & Maximum Bar Width – prevents boxes from becoming too tiny or excessively long
**Global Text Settings**
- Text color, size (Tiny → Huge), and bold option
**Individual Box Controls (20 independent boxes)**
- Show/Hide toggle
- SPX Price (or any symbol price level)
- Position Size (any positive/negative number; absolute value determines width)
- Fill color (override default green/red if desired)
### How It Works Internally
- All boxes are drawn only on the **last confirmed bar** (`barstate.islast`)
- Width calculation:
`Width = BaseWidth + (|Position Size| × Width per Unit)`
Clamped between Min and Max Bar Width
- Green boxes start at the current bar and extend forward (right)
- Red boxes end at the current bar and extend backward (left)
- Uses Pine Script v6 `box.new()` with `xloc.bar_index` for perfect alignment and performance
### Ideal Use Cases
- Visualizing daily/weekly **order block** or **fair value gap** interest levels with estimated size
- Mapping **dealer positioning**, gamma exposure levels, or large options interest
- Quickly seeing where the “smart money” is theoretically stacked on both sides of the market
- Clean chart markup for screenshots, mentoring, or live trading journals
A minimalist yet powerful tool favored by ICT, SMC, and footprint-style traders who want to see **where the big players might be positioned** — all in one glance without cluttering the chart with hundreds of objects.
Clean. Visual. Size-aware. Perfect for high-level market profiling.

SuperTrend Oscillator MTF█ OVERVIEW
SuperTrend Oscillator MTF is a multi-timeframe version of the classic SuperTrend converted into an oscillator. Instead of drawing the SuperTrend line on the price chart, it displays the distance of the close from the SuperTrend line simultaneously for the current timeframe and two additional timeframes. This allows you to instantly see the trend direction and strength across three selected timeframes in a single window.
█ CONCEPT
The classic SuperTrend value is subtracted from price and normalized so that trend direction can be directly compared across different timeframes without switching charts.
- Value above zero = price below SuperTrend line → bearish trend
- Value below zero = price above SuperTrend line → bullish trend
- The further away from zero, the stronger the trend.
█ FEATURES
- Three SuperTrend Oscillator lines: current TF, TF1 and TF2
- Automatic detection of 3-timeframe agreement
- BUY and SELL labels that appear only when all three timeframes turn in the same direction at the same moment
- Circle signals on every zero-line cross of the current timeframe
- Configurable soft gradient fill (can be disabled)
- Zero line changes color (green/red/gray) depending on 3-TF agreement
- Fully customizable colors for each timeframe
- Built-in alerts for all signal types
█ HOW TO USE
Add the indicator to the chart → set two additional timeframes and adjust ATR Period and Factor to suit your trading style.
Main settings:
- ATR Period → default 10
- Factor → default 3.0 (higher = fewer signals)
- TF 1 and TF 2 → any timeframes (e.g. 1H+4H, 4H+D, D+W, etc.)
- Enable gradient → turn fill on/off
- Show BUY/SELL labels (3 TF agreement) → enable/disable the strongest signals
Interpretation:
Two types of signals:
- Green/red circles → current timeframe changes trend direction (faster signal)
- BUY/SELL labels → all three timeframes simultaneously switch to the same direction (strongest confluence)
- Additionally, the zero line turns green or red when all three trends are aligned.
█ APPLICATIONS
Perfect for:
- Trend-following with multi-timeframe confirmation
- Filtering false breakouts on lower timeframes
- Scalping & day trading (use fast circle signals)
- Swing & position trading (wait for full 3-TF agreement)
Best combined with:
- Support/resistance levels and supply/demand zones – enter long after a confirmed breakout and retest of a key level (e.g. Change of Character, Break of Structure, Order Block, 0.618–0.786 Fibonacci) only when the oscillator shows 3-TF agreement or at least a bullish circle. Hold the trade to the next significant resistance/supply zone.
- Volume and Volume Profile – confirm move strength with rising volume and high-volume nodes at the breakout level. Declining volume while moving away from zero may signal trend exhaustion.
- Classic oscillators (RSI, Stochastic, MACD) – use primarily for spotting divergences and overbought/oversold conditions. One of the safest exits is when a regular or hidden divergence appears on RSI/Stochastic in an extreme zone, even if SuperTrend Oscillator MTF still shows alignment.
█ NOTES
- Works on all markets and all timeframes
- BUY/SELL labels (3-TF agreement) are the cleanest and strongest signals
- Circle signals are faster but more prone to noise
- Higher ATR Period = fewer signals, higher quality

ICT Fair Value Gap (FVG) Detector │ Auto-Mitigated │ 2025Accurate ICT / Smart Money Concepts Fair Value Gap (FVG) detector
Features:
• Detects both Bullish (-FVG) and Bearish (+FVG) using strict 3-candle rule
• Boxes automatically extend right until price mitigates them
• Boxes auto-delete when price closes inside the gap (true mitigation)
• No repainting – 100% reliable
• Clean, lightweight, and works on all markets & timeframes
• Fully customizable colors and transparency
How to use:
– Bullish FVG (green) = potential support / buy zone in uptrend
– Bearish FVG (red) = potential resistance / sell zone in downtrend
Exactly matches The Inner Circle Trader (ICT) methodology used by thousands of SMC traders in 2024–2025.
Enjoy and trade safe!

The 'Qualified' POI Scorer [PhenLabs]📊 The “Qualified” POI Scorer (Q-POI)
Version: PineScript™ v6
📌 Description
The “Qualified” POI Scorer helps intermediate traders overcome "analysis paralysis" by filtering Smart Money Concepts (SMC) structures based on their probability. Instead of flooding your chart with every possible Order Block, this script assigns a proprietary “Quality Score” (0-100) to each zone. It analyzes the strength of the displacement, the presence of imbalances (FVG), and liquidity mechanics to determine which zones are worth your attention. It is designed to clean up your charts and enforce discipline by visually fading out low-quality setups.
🚀 Points of Innovation
Dynamic “Glass UI” Transparency that automatically fades weak zones based on their score.
Proprietary Scoring Algorithm (0-100) based on three distinct institutional factors.
Visual Icon System that prints analytical context (💧— 🚀/🐌—🧱) directly on the chart.
Automated Mitigation Tracking that changes the visual state of zones after they are tested.
Displacement Velocity calculation using ATR to verify institutional intent.
🔧 Core Components
Liquidity Sweep Engine: Detects if a pivot point grabbed liquidity from the previous X bars before reversing.
FVG Validator: Checks if the move away from the zone created a valid Fair Value Gap.
Momentum Scorer: Calculates the size of the displacement candle relative to the Average True Range (ATR).
🔥 Key Features
Quality Filtering: Automatically hides or dims zones that score below 50 (user configurable).
State Management: Zones turn grey when mitigated and delete themselves when invalidated.
Visual Scorecard: Displays the exact numeric score on the zone for quick decision-making.
Time-Decay Logic: Keeps the chart clean by managing the lifespan of old zones.
🎨 Visualization
High Score Zones (80-100): Display as bright, semi-solid boxes indicating high probability.
Medium Score Zones (50-79): Display as translucent “glass” boxes.
Low Score Zones (<50): Display as faint “ghost” boxes or are completely hidden.
Rocket Icon (🚀): Indicates high momentum displacement.
Snail Icon (🐌): Indicates low momentum displacement.
Drop Icon (💧): Indicates the zone swept liquidity.
Brick Icon (🧱): Indicates the zone is supported by an FVG.
📖 Usage Guidelines
Swing Structure Length (Default: 5): Controls the sensitivity of the pivot detection; lower numbers create more zones, higher numbers find major swing points.
ATR Length (Default: 14): Determines the lookback period for calculating relative momentum.
Minimum Quality Score (Default: 50): The threshold for which zones are considered “valid” enough to be fully visible.
Bullish/Bearish Colors: Fully customizable colors that adapt their own transparency based on the score.
Show Weak Zones (Default: False): Toggles the visibility of zones that failed the quality check.
✅ Best Use Cases
Filtering noise during high-volatility sessions by focusing only on Score 80+ zones.
Confirming trend continuation entries by looking for the Rocket (🚀) momentum icon.
Avoiding “stale” zones by ignoring any box that has turned grey (Mitigated).
⚠️ Limitations
The indicator is reactive to closed candles and cannot predict news-driven spikes.
Scoring is based on technical structure and does not account for fundamental drivers.
In extremely choppy markets, the ATR filter may produce lower scores due to lack of displacement.
💡 What Makes This Unique
It transforms subjective SMC analysis into an objective, quantifiable score.
The visual hierarchy allows traders to assess chart quality in milliseconds without reading data.
It integrates three separate SMC concepts (Liquidity, Imbalance, Structure) into a single tool.
🔬 How It Works
Step 1: The script identifies a Swing High or Low based on your length input.
Step 2: It looks backward to see if that swing swept liquidity, and looks forward to check for an FVG and displacement.
Step 3: It calculates a weighted score (30pts for Sweep, 30pts for FVG, 40pts for Momentum).
Step 4: It draws the zone with a transparency level designated by the score and appends the relevant icons.
💡 Note:
For the best results, use this indicator on the timeframe you execute trades on (e.g., 15m or 1h). Do not use it to find entries on the 1m chart if your analysis is based on the 4h chart.

(CRT) MTF Candle Range Theory Model# 🚀 **CASH Pro MTF – Candle Range Theory (CRT) Indicator**
**The Smart Money ICT Setup Detector** 🔥
Hey Traders!
Here is the **ultimate Pine Script indicator** that automatically detects one of the most powerful Smart Money / ICT setups: **Candle Range Theory (CRT)**
---
### What is Candle Range Theory – CRT?
**CRT** is a high-probability price action model based on **liquidity grabs** and **range expansion**.
Price loves to:
1️⃣ Raid the low/high of the previous candle (take stop-losses)
2️⃣ Then reverse and run to the opposite side of the range (or beyond)
When this happens near a **key higher-timeframe level**, magic happens!
### Bullish CRT Model
- Price touches a **strong HTF support**
- Previous candle closes near that support
- Next candle **sweeps the low** (grabs liquidity)
- Current candle **closes above the raided low AND breaks the high** of the sweep candle
**Result → Aggressive bullish move expected!**
**Entry:** On close above the high (or on retest + MSS)
**Stop Loss:** Below the swept low
**Take Profit:** CRT High or next liquidity pool
### Bearish CRT Model
- Price touches a **strong HTF resistance**
- Previous candle closes near resistance
- Next candle **sweeps the high** (grabs buy stops)
- Current candle **closes below the raided high AND breaks the low** of the sweep candle
**Result → Strong bearish expansion!**
**Entry:** On close below the low
**Stop Loss:** Above the swept high
**Take Profit:** CRT Low or next downside liquidity
This whole setup can form in **just 3 candles**… or sometimes more if price consolidates after the sweep.
---
### Why This Indicator is Special
This is **NOT** a simple 3-candle pattern scanner!
This is a **true CRT + MTF confluence beast** with:
- **Multi-Timeframe Confirmation** (default 4H – fully customizable)
- **Built-in RSI Filter** (avoid fake moves in overbought/oversold)
- **Day-2 High/Low Levels** automatically drawn (the exact CRT range!)
- **Clean “LONG” / “SHORT” labels** right on the candle (no ugly arrows or offset)
- **Background highlight** on signal
- **Fully grouped inputs** – super clean settings panel
---
### Features at a Glance
| Feature | Included |
|--------------------------------|----------|
| Higher Timeframe Confirmation | Yes |
| RSI Overbought/Oversold Filter | Yes |
| Day-2 High/Low Lines + Labels | Yes |
| Clean Text Signals (no offset) | Yes |
| Background Highlight | Yes |
| Fully Customizable Colors & Text| Yes |
| Works on All Markets & TFs | Yes |
---
### How to Use
1. Add the indicator to your chart
2. Wait for a **LONG** or **SHORT** label to appear
3. Confirm price is near a **key HTF level** (order block, FVG, etc.)
4. Enter on close or retest (your choice)
5. Manage risk with the drawn Day-2 levels
**Pro Tip:** Combine with ICT Market Structure Shift (MSS) or Fair Value Gaps for even higher accuracy!

MP Universal FVG Detector🇺🇸 English Description
MP Universal FVG Detector
A clean and powerful indicator that automatically detects classic ICT 3-candle Fair Value Gaps on any market and any timeframe.
It highlights bullish and bearish imbalances with clear colored boxes, helping you quickly spot inefficient price zones where liquidity is likely to return.
Perfect for:
• Smart Money Concepts
• ICT/Inner Circle Trader setups
• Breaker / OB / Displacement traders
• Scalpers, day traders, swing traders
The indicator works with all assets: crypto, forex, stocks, indices, commodities — and on all timeframes.
🇺🇦 Опис українською
MP Universal FVG Detector
Чистий і потужний індикатор, який автоматично визначає класичні 3-свічкові Fair Value Gap (FVG) у стилі ICT на будь-якому ринку та будь-якому таймфреймі.
Він підсвічує бичачі та ведмежі дисбаланси кольоровими боксами, щоб ти легко бачив неефективні зони ціни, куди з великою ймовірністю повернеться ліквідність.
Підходить для:
• Smart Money Concepts
• ICT/Inner Circle Trader структур
• Breaker / Order Block / Displacement трейдерів
• Скальпінгу, внутрідеяльної та свінг-торгівлі
Працює з усіма активами: крипта, форекс, акції, індекси, товари — і на всіх таймфреймах.

Quantura - Fair Value GapIntroduction
“Quantura – Fair Value Gap” is a precision-engineered institutional concept indicator designed to automatically identify, visualize, and manage Fair Value Gaps (FVGs) across any market or timeframe. It enables traders to observe price inefficiencies, potential liquidity voids, and retracement areas that often act as magnets for price rebalancing.
Originality & Value
Unlike many public FVG scripts that only highlight candle gaps, this indicator integrates dynamic filters and adaptive logic to determine the strength and reliability of each gap. It merges overlapping zones intelligently and optionally extends valid imbalances forward for ongoing reference.
Its value lies in:
Dynamic statistical filtering based on gap standard deviation.
Optional volume confirmation for high-confidence FVGs.
Automatic merging of overlapping or adjacent gaps for clean visualization.
Support for both bullish and bearish imbalances.
Signal alerts when gaps are filled or rebalanced by price.
Functionality & Core Logic
Detects Fair Value Gaps by comparing candle-to-candle price displacement.
Applies a Gap Filter (standard deviation-based) to qualify valid gaps.
Optionally validates gaps formed under significant volume conditions.
Draws color-coded boxes to mark bullish (discount) and bearish (premium) inefficiencies.
Monitors each FVG until price fills the gap, at which point the box is visually closed.
Provides optional signal markers (“▲” or “▼”) when rebalancing occurs.
Parameters & Customization
Gap Filter: Sets the minimum statistical deviation required for a valid FVG. Higher values detect fewer, stronger gaps.
Volume Filter: Toggles additional validation using relative volume strength.
Volume Sensitivity: Adjusts how much above-average volume must be present to confirm a gap.
Bullish/Bearish Colors: Customize color schemes for imbalance zones.
Extend Gaps: Optionally extend open gaps forward for better confluence tracking.
Signals: Enables or disables gap-fill signal markers.
Visualization & Display
Bullish FVGs: Appear in blue-tinted boxes, indicating potential demand-side inefficiencies.
Bearish FVGs: Appear in red-tinted boxes, representing potential supply-side inefficiencies.
Overlapping zones are merged automatically to maintain clarity.
Filled gaps remain visible for historical context, allowing for post-event analysis.
Optional signal arrows display when price returns to rebalance an FVG.
Use Cases
Identify institutional inefficiencies and liquidity voids.
Detect premium and discount levels in trending markets.
Combine with market structure or order block indicators for confluence.
Track when price rebalances inefficiencies to refine entry/exit points.
Build FVG-based algorithmic strategies that rely on structural imbalance resolution.
Limitations & Recommendations
The indicator detects structural imbalances but does not predict future direction or guarantee profitability.
Volume filters may behave differently across brokers due to data-source differences.
Use alongside structure or liquidity tools for enhanced decision-making.
Extreme volatility or illiquid assets may generate temporary invalid gaps.
Markets & Timeframes
Compatible with all markets (crypto, forex, equities, indices, futures) and all timeframes. Recommended for multi-timeframe confluence analysis — e.g., detecting higher-timeframe FVGs and refining lower-timeframe entries.
Author & Access
Developed 100% by Quantura. Published as a Open-source script indicator. Access is free.
Compliance Note
This description adheres fully to TradingView’s House Rules and Script Publishing Requirements . It provides a detailed explanation of originality, core logic, limitations, and appropriate use — with no unrealistic or misleading performance claims.

REJECTION DETECTOR🔥 CTR (Candle Terjepit - Rejection)
This indicator is specifically designed to detect Rejection Candles, which are moments when the price rejects a certain level and has the potential to form a strong reversal or rapid reaction — an important signal for scalpers and price action traders.
💡 Key Concept:
Rejection is a form of market reaction to areas of liquidity, support-resistance, or order block zones. Candles with long tails and small bodies indicate an imbalance between buyers and sellers, providing an early indication that the price may soon reverse.
⚙️ Key Features
🔍 Automatic Rejection Candle Detection (Buy & Sell)
🧠 Body-to-tail ratio filter for more precise signal validation
🎨 Customizable candle colors and appearance
📊 Suitable for all pairs and timeframes

Ornstein-Uhlenbeck Trend Channel [BOSWaves]Ornstein-Uhlenbeck Trend Channel - Adaptive Mean Reversion with Dynamic Equilibrium Geometry
Overview
The Ornstein-Uhlenbeck Trend Channel introduces an advanced equilibrium-mapping framework that blends statistical mean reversion with adaptive trend geometry. Traditional channels and regression bands react linearly to volatility, often failing to capture the natural rhythm of price equilibrium. This model evolves that concept through a dynamic reversion engine, where equilibrium adapts continuously to volatility, trend slope, and structural bias - forming a living channel that bends, expands, and contracts in real time.
The result is a smooth, equilibrium-driven representation of market balance - not just trend direction. Instead of static bands or abrupt slope shifts, traders see fluid, volatility-aware motion that mirrors the natural pull-and-release dynamic of market behavior. Each channel visualizes the probabilistic boundaries of fair value, showing where price tends to revert and where it accelerates away from its statistical mean.
Unlike conventional envelopes or Bollinger-type constructs, the Ornstein-Uhlenbeck framework is volatility-reactive and equilibrium-sensitive, providing traders with a contextual map of where price is likely to stabilize, extend, or exhaust.
Theoretical Foundation
The Ornstein-Uhlenbeck Trend Channel is inspired by stochastic mean-reversion processes - mathematical models used to describe systems that oscillate around a drifting equilibrium. While linear regression channels assume constant variance, financial markets operate under variable volatility and shifting equilibrium points. The OU process accounts for this by treating price as a mean-seeking motion governed by volatility and trend persistence.
At its core are three interacting components:
Equilibrium Mean (μ) : Represents the evolving balance point of price, adjusting to directional bias and volatility.
Reversion Rate (θ) : Defines how strongly price is pulled back toward equilibrium after deviation, capturing the self-correcting nature of market structure.
Volatility Coefficient (σ) : Controls how far and how quickly price can diverge from equilibrium before mean reversion pressure increases.
By embedding this stochastic model inside a volatility-adjusted framework, the system accurately scales across different markets and conditions - maintaining meaningful equilibrium geometry across crypto, forex, indices, or commodities. This design gives traders a mathematically grounded yet visually intuitive interpretation of dynamic balance in live market motion.
How It Works
The Ornstein-Uhlenbeck Trend Channel is constructed through a structured multi-stage process that merges stochastic logic with volatility mechanics:
Equilibrium Estimation Core : The indicator begins by identifying the evolving mean using adaptive smoothing influenced by trend direction and volatility. This becomes the live centerline - the statistical anchor around which price naturally oscillates.
Volatility Normalization Layer : ATR or rolling deviation is used to calculate volatility intensity. The output scales the channel width dynamically, ensuring that boundaries reflect current variance rather than static thresholds.
Directional Bias Engine : EMA slope and trend confirmation logic determine whether equilibrium should tilt upward or downward. This creates asymmetrical channel motion that bends with the prevailing trend rather than staying horizontal.
Channel Boundary Construction : Upper and lower bands are plotted at volatility-proportional distances from the mean. These envelopes form the “statistical pressure zones” that indicate where mean reversion or acceleration may occur.
Signal and Lifecycle Control : Channel breaches, mean crossovers, and slope flips mark statistically significant events - exhaustion, continuation, or rebalancing. Older equilibrium zones gradually fade, ensuring a clear, context-aware visual field.
Through these layers, the channel forms a continuously updating equilibrium corridor that adapts in real time - breathing with the market’s volatility and rhythm.
Interpretation
The Ornstein-Uhlenbeck Trend Channel reframes how traders interpret balance and momentum. Instead of viewing price as directional movement alone, it visualizes the constant tension between trending force and equilibrium pull.
Uptrend Phases : The equilibrium mean tilts upward, with price oscillating around or slightly above the midline. Upper band touches signal momentum extension; lower touches reflect healthy reversion.
Downtrend Phases : The mean slopes downward, with upper-band interactions marking resistance zones and lower bands acting as reversion boundaries.
Equilibrium Transitions : Flat mean sections indicate balance or distribution phases. Breaks from these neutral zones often precede directional expansion.
Overextension Events : When price closes beyond an outer boundary, it marks statistically significant disequilibrium - an early warning of exhaustion or volatility reset.
Visually, the OU channel translates volatility and equilibrium into structured geometry, giving traders a statistical lens on trend quality, reversion probability, and volatility stress points.
Strategy Integration
The Ornstein-Uhlenbeck Trend Channel integrates seamlessly into both mean-reversion and trend-continuation systems:
Trend Alignment : Use mean slope direction to confirm higher-timeframe bias before entering continuation setups.
Reversion Entries : Target rejections from outer bands when supported by volume or divergence, capturing snapbacks toward equilibrium.
Volatility Breakout Mapping : Monitor boundary expansions to identify transition from compression to expansion phases.
Liquidity Zone Confirmation : Combine with BOS or order-block indicators to validate structural zones against equilibrium positioning.
Momentum Filtering : Align with oscillators or volume profiles to isolate equilibrium-based pullbacks with statistical context.
Technical Implementation Details
Core Engine : Stochastic Ornstein-Uhlenbeck process for continuous mean recalibration.
Volatility Framework : ATR- and deviation-based scaling for dynamic channel expansion.
Directional Logic : EMA-slope driven bias for adaptive mean tilt.
Channel Composition : Independent upper and lower envelopes with smoothing and transparency control.
Signal Structure : Alerts for mean crossovers and boundary breaches.
Performance Profile : Lightweight, multi-timeframe compatible implementation optimized for real-time responsiveness.
Optimal Application Parameters
Timeframe Guidance:
1 - 5 min : Reactive equilibrium tracking for short-term scalping and microstructure analysis.
15 - 60 min : Medium-range setups for volatility-phase transitions and intraday structure.
4H - Daily : Macro equilibrium mapping for identifying exhaustion, distribution, or reaccumulation zones.
Suggested Configuration:
Mean Length : 20 - 50
Volatility Multiplier : 1.5× - 2.5×
Reversion Sensitivity : 0.4 - 0.8
Smoothing : 2 - 5
Parameter tuning should reflect asset liquidity, volatility, and desired reversion frequency.
Performance Characteristics
High Effectiveness:
Trending environments with cyclical pullbacks and volatility oscillation.
Markets exhibiting consistent equilibrium-return behavior (indices, majors, high-cap crypto).
Reduced Effectiveness:
Low-volatility consolidations with minimal variance.
Random walk markets lacking definable equilibrium anchors.
Integration Guidelines
Confluence Framework : Pair with BOSWaves structural tools or momentum oscillators for context validation.
Directional Control : Follow mean slope alignment for directional conviction before acting on channel extremes.
Risk Calibration : Use outer band violations for controlled contrarian entries or trailing stop management.
Multi-Timeframe Synergy : Derive macro equilibrium zones on higher timeframes and refine entries on lower levels.
Disclaimer
The Ornstein-Uhlenbeck Trend Channel is a professional-grade equilibrium and volatility framework. It is not predictive or profit-assured; performance depends on parameter calibration, volatility regime, and disciplined execution. BOSWaves recommends using it as part of a comprehensive analytical stack combining structure, liquidity, and momentum context.

Liquidity Sniper V3 (ANTI-FAKEOUT)An advanced institutional trading indicator combining liquidity pool targeting, smart money concepts, and momentum-based entries with comprehensive risk management.
🎯 CORE FEATURES:
- Liquidity Sniper Module: Identifies and targets major liquidity pools (PDH/PDL, PWH/PWL, Equal Highs/Lows, HVN/LVN edges)
- Anti-Fakeout Stack: 10-layer confirmation system including VWAP reclaim, micro BOS, displacement, relative volume, and mitigation entries
- Momentum Engulf Add-On: Catches high-velocity impulsive moves with engulfing candles, volume spikes, and volatility breakouts
- GARCH Volatility Filter: Dynamic volatility analysis to avoid choppy conditions
- Multi-Timeframe Confirmation: Ensures alignment across timeframes before entries
📊 SIGNAL CLASSIFICATION:
- BEST (Green): Highest probability setups with all confirmations aligned - 6.0+ score
- BETTER (Medium Green): Strong setups with most confirmations - 4.5-6.0 score
- GOOD (Light Green): Valid setups with basic confirmations - 3.0-4.5 score
🔍 TRADE SCENARIOS:
S1: Liquidity Reversal - Sweeps + reversals at key levels with displacement
S2: Continuation - Trend following with VWAP mean reversion
S3: Mean Reversion - Extreme deviations (2σ+) with Fibonacci exhaustion
S4: Deep Sweep - 3σ sweeps at major liquidity with high confluence
⚡ MOMENTUM TRIGGERS:
- MET (Momentum Engulf): Bullish/bearish engulfing with 1.5x+ volume spike and ATR impulse
- VBT (Volatility Breakout): Range breakouts with sigma bursts and participation
🛡️ RISK MANAGEMENT:
- Dynamic TP/SL based on ATR, VWAP bands, and liquidity pools
- 3-tier targets (T1: VWAP, T2: Nearest pool, T3: 5R extension)
- Early invalidation tracking (0.5R movement monitoring)
- Minimum 2:1 RR requirement with cooldown periods
- RTH session filters and anti-spam protection
📈 TECHNICAL EDGE:
- SMT Divergence detection vs ES correlation
- CVD (Cumulative Volume Delta) divergence confirmation
- FVG (Fair Value Gap) and Order Block mitigation entries
- Equal highs/lows clustering analysis
- Volume profile HVN/LVN identification
⚙️ FULLY CUSTOMIZABLE:
All parameters adjustable including cooldowns, proximity thresholds, ATR multipliers, RR floors, and scenario weights.
Perfect for: ES/NQ futures, forex majors, and liquid stocks. Works on 1-15 min timeframes. Best results during NY session (9:35-11:00 AM & 1:30-3:30 PM ET).
Created for serious traders seeking institutional-grade edge with quantifiable risk/reward and high-probability setups

MFT Supply/Demand — Top2 (Opacity by Strength, Minimal Labels)Script Overview — “MFT Supply/Demand — Top 2 (Opacity by Strength, Minimal Labels)”
This multi–timeframe (MTF) Pine Script indicator automatically detects and displays the strongest supply and demand zones across selected higher (HTF), mid (MTF), and lower (LTF) timeframes.
It dynamically identifies large-body, high-volume candles (and optional order-block breakouts) that signal institutional activity, then plots only the two strongest supply zones above the current price and two strongest demand zones below the current price — keeping the chart clean and focused.

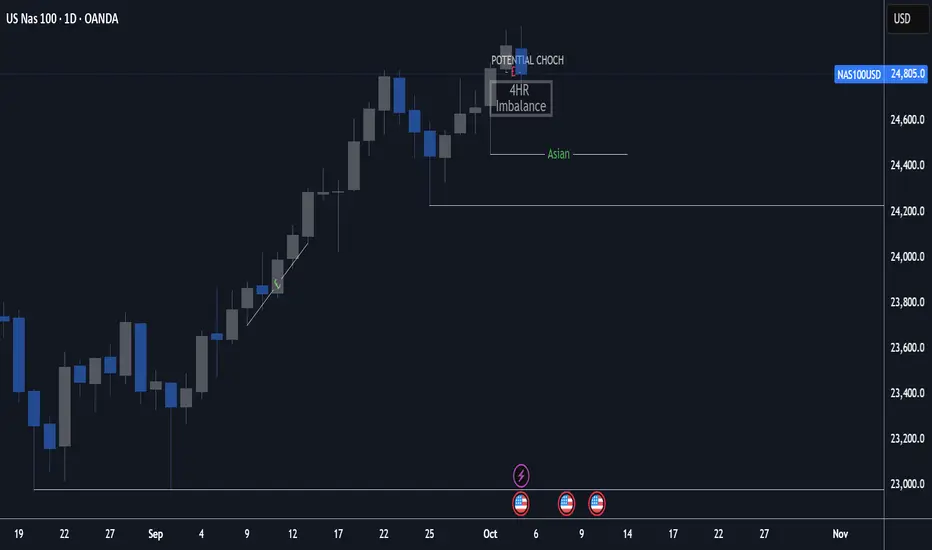
4H + 15m Sell Signals It shows sell positions on the 15 min based on 4 hour ,imbalance, order block and swing high and low frameworks.